Showing posts with label apache-kafka. Show all posts
Showing posts with label apache-kafka. Show all posts


Connecting Apache NiFi to Apache Atlas For Data Governance At Scale in Streaming
Connecting Apache NiFi to Apache Atlas For Data Governance At Scale in Streaming
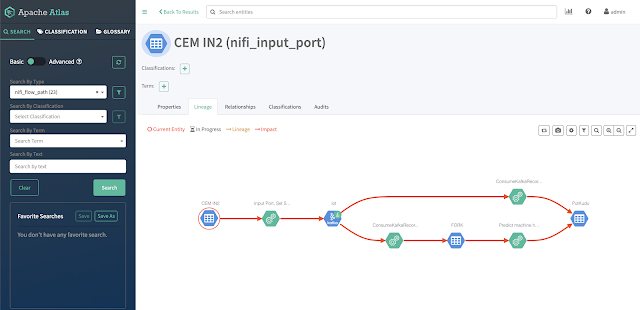
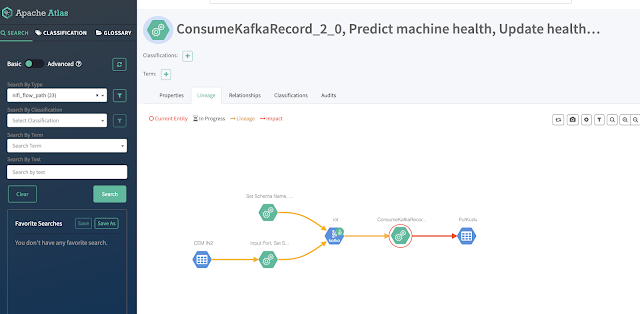
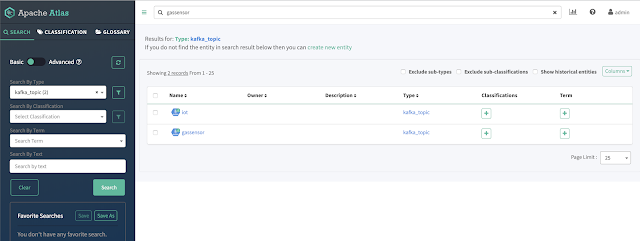
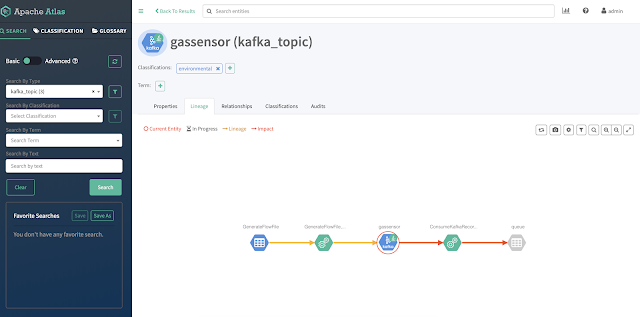
Once connected you can see NiFi and Kafka flowing to Atlas.
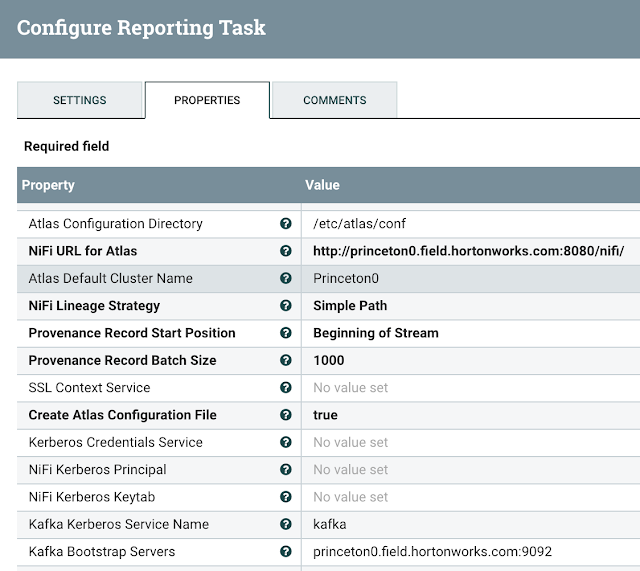
You must add Atlas Report to NiFi cluster.

Add a ReportLineageToAtlas under Controller Settings / Reporting Tasks
You must add URL for Atlas, Authentication method and if basic, username/password.

You need to set Atlas Configuration directory, NiFi URL to use, Lineage Strategy - Complete Path
Another example with an AWS hosted NiFi and Atlas:


IMPORTANT NOTE: Keep your Atlas Default Cluster Name consistent with other applications for Cloudera clusters, usually the name cm is a great option or default.

You can now see the lineage state:

Configure Atlas to Be Enabled and Have Kafka

Have Atlas Service enabled in NiFi configuration

Example Configuration
You must have access to Atlas Application Properties.
/etc/atlas/conf
atlas-application.properties
#Generated by Apache NiFi ReportLineageToAtlas ReportingTask at 2020-02-21T17:18:28.493Z
#Fri Feb 21 17:18:28 UTC 2020
atlas.kafka.bootstrap.servers=princeton0.field.hortonworks.com\:9092
atlas.enableTLS=false
atlas.kafka.client.id=ReportLineageToAtlas.687a48e2-0170-1000-0000-00000a0de4ea
atlas.cluster.name=Princeton0
atlas.kafka.security.protocol=PLAINTEXT
atlas-server.properties
princeton0.field.hortonworks.com:atlas.authentication.method.kerberos=false
princeton0.field.hortonworks.com:atlas.enableTLS=false
princeton0.field.hortonworks.com:atlas.kafka.zookeeper.connection.timeout.ms=30000
princeton0.field.hortonworks.com:atlas.kafka.zookeeper.session.timeout.ms=60000
princeton0.field.hortonworks.com:atlas.kafka.zookeeper.sync.time.ms=20
princeton0.field.hortonworks.com:atlas.server.bind.address=0.0.0.0
princeton0.field.hortonworks.com:atlas.server.http.port=31000
princeton0.field.hortonworks.com:atlas.server.https.port=31443
Running Atlas


See:
- https://atlas.apache.org/#/
- https://medium.com/@kandalkarbhushan/integrating-nifi-with-atlas-in-secured-environment-c1b0f3cb7318
- https://docs.cloudera.com/HDPDocuments/HDF3/HDF-3.1.1/bk_installing-hdf-and-hdp/content/nifi-atlas.html
- https://docs.cloudera.com/HDPDocuments/HDF3/HDF-3.4.1.1/installing-hdf-and-hdp-ppc/content/configure_nifi_for_atlas_integration.html
- https://docs.cloudera.com/runtime/7.0.2/cdp-governance-overview/topics/atlas-overview.html
- https://www.datainmotion.dev/2020/02/apache-atlas-for-monitoring-edge2ai-iot.html
- https://docs.cloudera.com/cloudera-manager/7.0.3/reference/topics/cm_props_cr703_atlas.html


Analyzing Wood Burning Stoves with FLaNK Stack Part 2 - Analytics
Analyzing Wood Burning Stoves with FLaNK Stack Part 2 - Analytics - Part 2
Part 1: https://www.datainmotion.dev/2020/01/analyzing-wood-burning-stoves-with.htmlSee: https://shop.pimoroni.com/products/sgp30-air-quality-sensor-breakout
- Sensiron SGP30 TVOC and eCO2 sensor
- TVOC sensing from 0-60,000 ppb (parts per billion)
- CO2 sensing from 400 to 60,000 ppm (parts per million)
Running the fire I can see I am getting higher CO2 production than normal.
Since I stored my data in Kudu tables, it's easy to analyze with Impala and Hue.
select equivalentco2ppm, totalvocppb, systemtime
from gassensors
order by equivalentco2ppm desc

select avg( cast( equivalentco2ppm as double) ) CO2PPM
from gassensors
The average was 493.
Now that we have some time series data, I can start feeding this to some standard machine learning algorithms and have CML and a Data Scientist if me some analytics and help me determine where I a may want an alert.
When should you worry: https://www.co2meter.com/blogs/news/56788737-co2-sensor-range-compared https://www.co2meter.com/blogs/news/56788737-co2-sensor-range-compared
Up to 400 is considered normal.
400 to 1,000 is typical of occupied locations with air exchange.
Once you get over 1,000 you start getting drowsy and noticeable effects.
Over 2,000 you get headaches, this is a concern. Over 5,000 you should remove yourself from the situation.
select appx_median(cast(equivalentco2ppm as double)) median, min(cast(equivalentco2ppm as double)) min,
max(cast(equivalentco2ppm as double)) max, avg(cast(equivalentco2ppm as double)) avg,
stddev(cast(equivalentco2ppm as double)) standarddev,
stddev_pop(cast(equivalentco2ppm as double)) standardpop
from gassensors

Let's start setting alerts at various levels.
We can also look at the indoor air quality.
As a baseline for the sensor, in an empty ventilated room my numbers are:
{"uuid": "sgp30_uuid_glv_20200123132631", "ipaddress": "192.168.1.221", "runtime": "0", "host": "garden3", "host_name": "garden3", "macaddress": "dc:a6:32:32:98:20", "end": "1579785991.7173052", "te": "0.0261075496673584", "systemtime": "01/23/2020 08:26:31", "cpu": 53.5, "diskusage": "109138.7 MB", "memory": 46.5, "equivalentco2ppm": " 412", "totalvocppb": " 6", "id": "20200123132631_dec207f1-9234-4bee-ad38-a0256629c976"}
{"uuid": "sgp30_uuid_snt_20200123132633", "ipaddress": "192.168.1.221", "runtime": "0", "host": "garden3", "host_name": "garden3", "macaddress": "dc:a6:32:32:98:20", "end": "1579785993.7479923", "te": "0.02589273452758789", "systemtime": "01/23/2020 08:26:33", "cpu": 55.6, "diskusage": "109137.0 MB", "memory": 46.5, "equivalentco2ppm": " 403", "totalvocppb": " 5", "id": "20200123132633_3bd5fb39-d6b2-4f23-8904-0ada862ede2b"}
{"uuid": "sgp30_uuid_uha_20200123132635", "ipaddress": "192.168.1.221", "runtime": "0", "host": "garden3", "host_name": "garden3", "macaddress": "dc:a6:32:32:98:20", "end": "1579785995.7779448", "te": "0.025917768478393555", "systemtime": "01/23/2020 08:26:35", "cpu": 51.1, "diskusage": "109135.3 MB", "memory": 46.5, "equivalentco2ppm": " 406", "totalvocppb": " 3", "id": "20200123132635_0412f445-9b8c-43a8-b34a-a5466f914be7"}
{"uuid": "sgp30_uuid_wau_20200123132637", "ipaddress": "192.168.1.221", "runtime": "0", "host": "garden3", "host_name": "garden3", "macaddress": "dc:a6:32:32:98:20", "end": "1579785997.8079107", "te": "0.02591681480407715", "systemtime": "01/23/2020 08:26:37", "cpu": 58.7, "diskusage": "109133.5 MB", "memory": 47.1, "equivalentco2ppm": " 406", "totalvocppb": " 13", "id": "20200123132637_73f069d9-0beb-4d06-a638-2bd92e50ece7"}
{"uuid": "sgp30_uuid_lse_20200123132639", "ipaddress": "192.168.1.221", "runtime": "0", "host": "garden3", "host_name": "garden3", "macaddress": "dc:a6:32:32:98:20", "end": "1579785999.83777", "te": "0.025897502899169922", "systemtime": "01/23/2020 08:26:39", "cpu": 53.1, "diskusage": "109131.6 MB", "memory": 46.5, "equivalentco2ppm": " 410", "totalvocppb": " 1", "id": "20200123132639_1aa392fe-0eb7-4332-9631-83ac5838e153"}
Very low parts per billion between 1 and 13, with nothing changing in the static room seems like that's a 10 ppb margin of error, we can run some queries in Hue for better stats.
Let's look at some data over time for TVOC.
select appx_median(cast(totalvocppb as double)) median, min(cast(totalvocppb as double)) min,
max(cast(totalvocppb as double)) max, avg(cast(totalvocppb as double)) avg,
stddev(cast(totalvocppb as double)) standarddev,
stddev_pop(cast(totalvocppb as double)) standardpop
from gassensors

So what's a good TVOC? On average we are below the range of potential irritation of 120 - 1200 ppb. We do have some variance for sensor capabilities and lack of professional calibration. Median and Average numbers look good. The maximum is a bit disturbing but can be sensor error, warm up time or other data quality issues. We'll have to dive more into the numbers.
Next we can look at PM 2.5 values.
Need to crowd source some science here.
We had 3,500+ records of data over 120.
select count(*)
from gassensors
where cast(totalvocppb as double) > 120
I can see a number of records and the data climb as the fire burns and we add more cherry wood.
select systemtime, equivalentco2ppm, totalvocppb
from gassensors
where cast(totalvocppb as double) > 120
order by systemtime asc
I should also note that the time series data is coming in every 2 seconds.
select to_timestamp(systemtime, 'MM/dd/yyyy HH:mm:ss'), EXTRACT(to_timestamp(systemtime, 'MM/dd/yyyy HH:mm:ss'),
'MINUTE') as minute ,
cast(totalvocppb as double) as TVOC, cast(equivalentco2ppm as double) CO2PPM
from gassensors
order by systemtime desc
'MINUTE') as minute ,
cast(totalvocppb as double) as TVOC, cast(equivalentco2ppm as double) CO2PPM
from gassensors
order by systemtime desc
Resources
- https://joshefin.xyz/air-quality-with-raspberrypi-pms7003-and-java/
- https://en.wikipedia.org/wiki/Indoor_air_quality
- https://www.hackster.io/bastiaan-slee/chiiiiiirp-indoor-air-quality-measurement-and-alarm-260622
- http://wiki.seeedstudio.com/Grove-VOC_and_eCO2_Gas_Sensor-SGP30/
- https://learn.adafruit.com/adafruit-sgp30-gas-tvoc-eco2-mox-sensor?view=all
- https://www.weather.gov/arx/why_dewpoint_vs_humidity
- https://www.health.state.mn.us/communities/environment/air/toxins/voc.htm
- https://www.mdpi.com/2071-1050/11/22/6225/htm
- https://impala.apache.org/docs/build/html/topics/impala_datetime_functions.html#datetime_functions__from_timestamp
Analyzing Wood Burning Stoves with FLaNK Stack: MiNiFi, Flink, NiFi, Kafka, Kudu
Analyzing Wood Burning Stoves with FLaNK Stack: MiNiFi, Flink, NiFi, Kafka, Kudu (FLaNK Stack)
Winter has arrived, finally. The 50-70 F days are over, it dropped below 30 F in Princeton, so time to light up the wood burning stove and burn some season cherry wood (We get cherry wood from a local tree service that removes dead trees for people and then season the wood. Recycle!) . It's great for camp fires, smoking meats and for heating up our house. Also if you have no smelled cherry wood smoke it is amazing. I wanted to see if having a fire that raised my houses temperature from 67 F to 87 F would produce noticeable sensor readings. Fortunately, I have a thermal camera sensor (Pimoroni rocks! Add another thing to my list of thinks I love from Britain (Dr. Who, Jelly Babies, Pimoroni and my awesome boss Dan). I also have Raspberry Pi sensors for temperature, humidity, light and various gas sensors. Let's see what the numbers look like. The temperatures and images start greeen and yellow and as they heat up turn red, purple and then pure white. That's real hot. Fortunately the Raspberry Pis didn't overheat, had to open a window when we got close to 90. Yes, temperature regulation and maybe an automated wood feeder would be nice.


Inside the Stove

Cherry Wood burning nice in stove, notice Fire on Cloudera T-Shirt

Four USB PS3 Eye Cameras ($7!!!) attached to Raspberry Pi 3B+ and 4s.

A very organized professional assortment of Pis and sensors...


Some Sensor Readings:
{"bme280_tempf": "93.78", "uuid": "20200117195629_104c9f2a-b5a8-43d2-8386-57b7bd05f55a", "systemtime": "01/17/2020 14:56:29", "bme280_altitude": "-41.31", "memory": 92.1, "max30105_value": "84.00", "end": "1579290989.4628081", "imgnamep": "images/bog_image_p_20200117195629_104c9f2a-b5a8-43d2-8386-57b7bd05f55a.jpg", "max30105_temp": "34.56", "ipaddress": "192.168.1.251", "diskusage": "44726.6", "host": "garden2", "max30105timestamp": "20200117-145629-345697", "starttime": "01/17/2020 13:48:29", "bme280_altitude_feet": "-135.53", "max30105_delta": "0.00", "max30105_mean": "84.00", "max30105_detected": "False", "bme280_tempc": "34.32", "bme280_pressure": "1034.61", "cputemp": 59, "te": "4079.87322807312", "imgname": "images/bog_image_20200117195629_104c9f2a-b5a8-43d2-8386-57b7bd05f55a.jpg"}
[{"uuid":"sgp30_uuid_xyg_20200117185015","ipaddress":"192.168.1.221","runtime":"0","host":"garden3","host_name":"garden3","macaddress":"dc:a6:32:32:98:20","end":"1579287015.6653564","te":"0.025962352752685547","systemtime":"01/17/2020 13:50:15","cpu":55.0,"diskusage":"109290.8 MB","memory":29.7,"equivalentco2ppm":" 400","totalvocppb":" 37","id":"20200117185015_b8fbd9c1-fa30-4f70-b20d-e43a2c703b18"}]
{"uuid": "rpi4_uuid_kse_20200117222947", "ipaddress": "192.168.1.243", "host": "rp4", "host_name": "rp4", "macaddress": "dc:a6:32:03:a6:e9", "systemtime": "01/17/2020 17:29:47", "cpu": 50.8, "diskusage": "46208.0 MB", "memory": 18.2, "id": "20200117222947_e9299089-d56f-468b-8bac-897a2918307a", "temperature": "48.96355155197982", "pressure": "1035.4460084255888", "humidity": "0.0", "lux": "49.0753", "proximity": "0", "gas": "Oxidising: 30516.85 Ohms\nReducing: 194406.50 Ohms\nNH3: 104000.00 Ohms"}
{"host": "rp4", "cputemp": "72", "ipaddress": "192.168.1.243", "endtime": "1579293634.02", "runtime": "0.00", "systemtime": "01/17/2020 15:40:34", "starttime": "01/17/2020 15:40:34", "diskfree": "46322.7", "memory": "17.1", "uuid": "20200117204034_99f49e71-7444-4fd7-b82e-7e03720c4c39", "image_filename": "20200117204034_d9f811a3-8582-4b47-b4b4-cb6ec51cca04.jpg"}
The next step is to have NiFi load the data to Kudu, Hive, HBase or Phoenix tables for analysis with Cloudera Data Science Work Bench and some machine learning analytics in Python 3 on either Zeppelin or Jupyter notebooks feeding CDSW. Then I can host my final model on K8 within CDSW for a real edge to AI application and solve the issue of how much fire in my house is too much?
This article is part of the FLaNK Stack series, highlighting using the FL(ink) Apache NiFi Kafka Kudu stack for big data streaming development with IoT and AI applications.

Subscribe to:
Posts (Atom)