Harnessing the Data Lifecycle for Customer Experience Optimization: Streaming Classifications
For a deeper dive see this past webinar: available here.
In the use case solved for this webinar, I am a Streaming Engineer at an airline, CloudAir. I need to find, filter and clean Twitter streams then perform sentiment analysis.
Score Models in the Stream to Act


As the Streaming Engineer at CloudAIR I am responsible for ingesting data from thousands of sources, operationalizing machine learning models as part of our streams, running real-time ELT/ETL processes and building event processing systems running from devices, servers and edge nodes. For today’s use case, one of our ML engineers had given me a model that was deployed into one of our production Cloudera Machine Learning (CML) environments. I logged into Cloudera Data Platform (CDP), found the model, tested it, and then extracted the information I need to add this model to our streaming ingest flow for the social media team.

I have been given permissions to access the airline-sentiment workshop in CDP Public Cloud.

I can see all the models deployed in the project I have access to. I see that predict-sentiment is the
one I am to use. It is deployed and has 8GB of RAM and 2 vCPU.

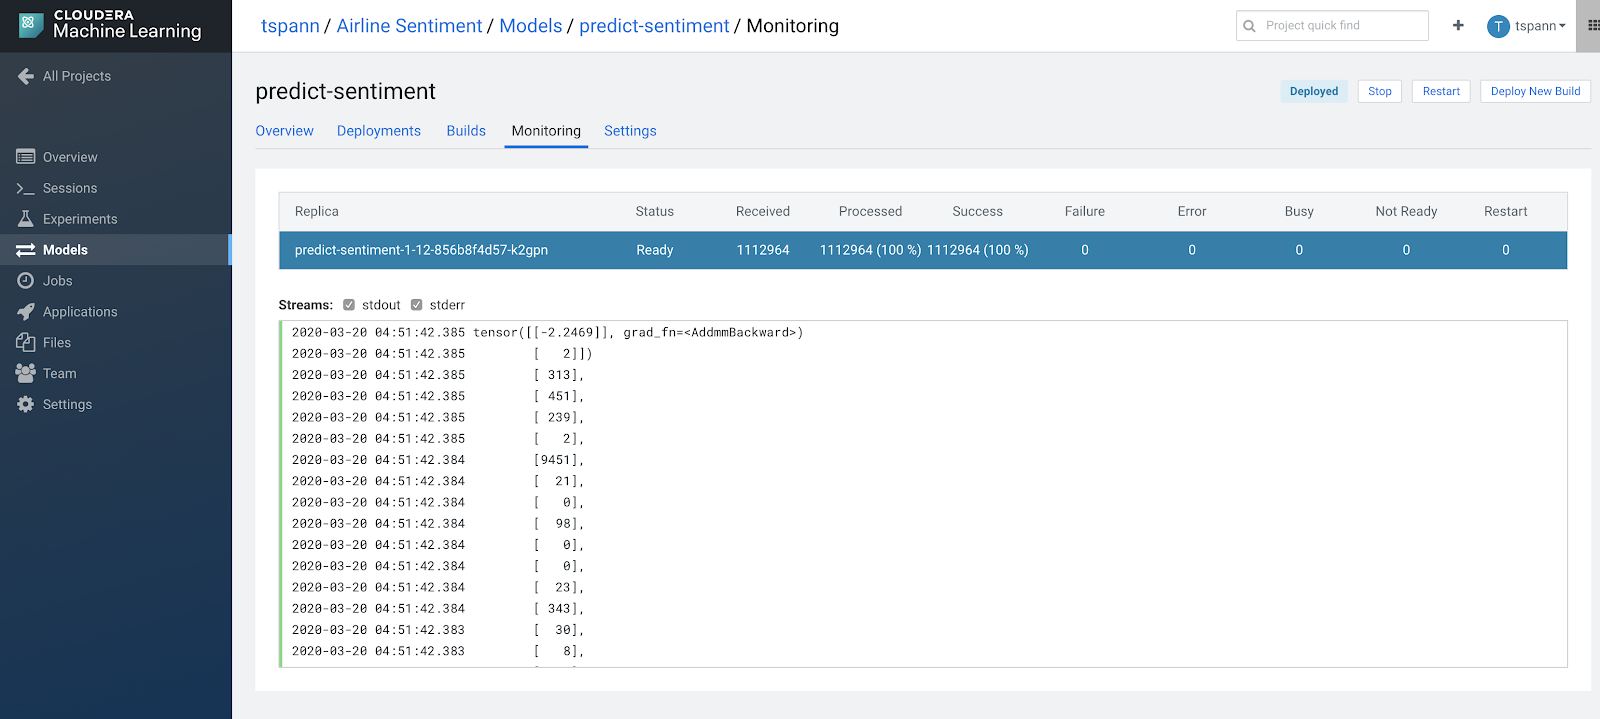
I can see that it has been running successfully for a while and I can test it right from the project.
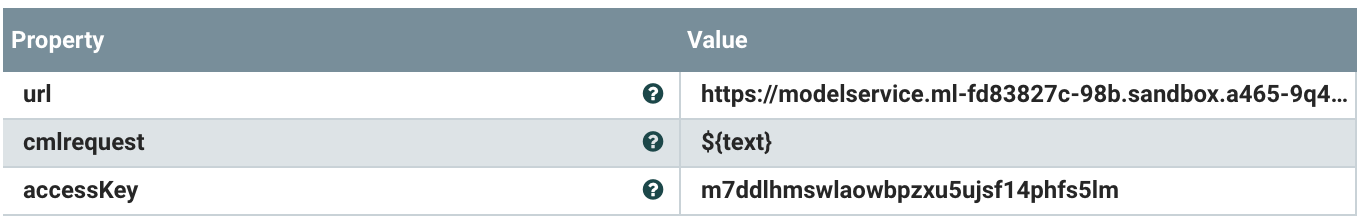
You can see the URL after the POST and the accessKey is in JSON.
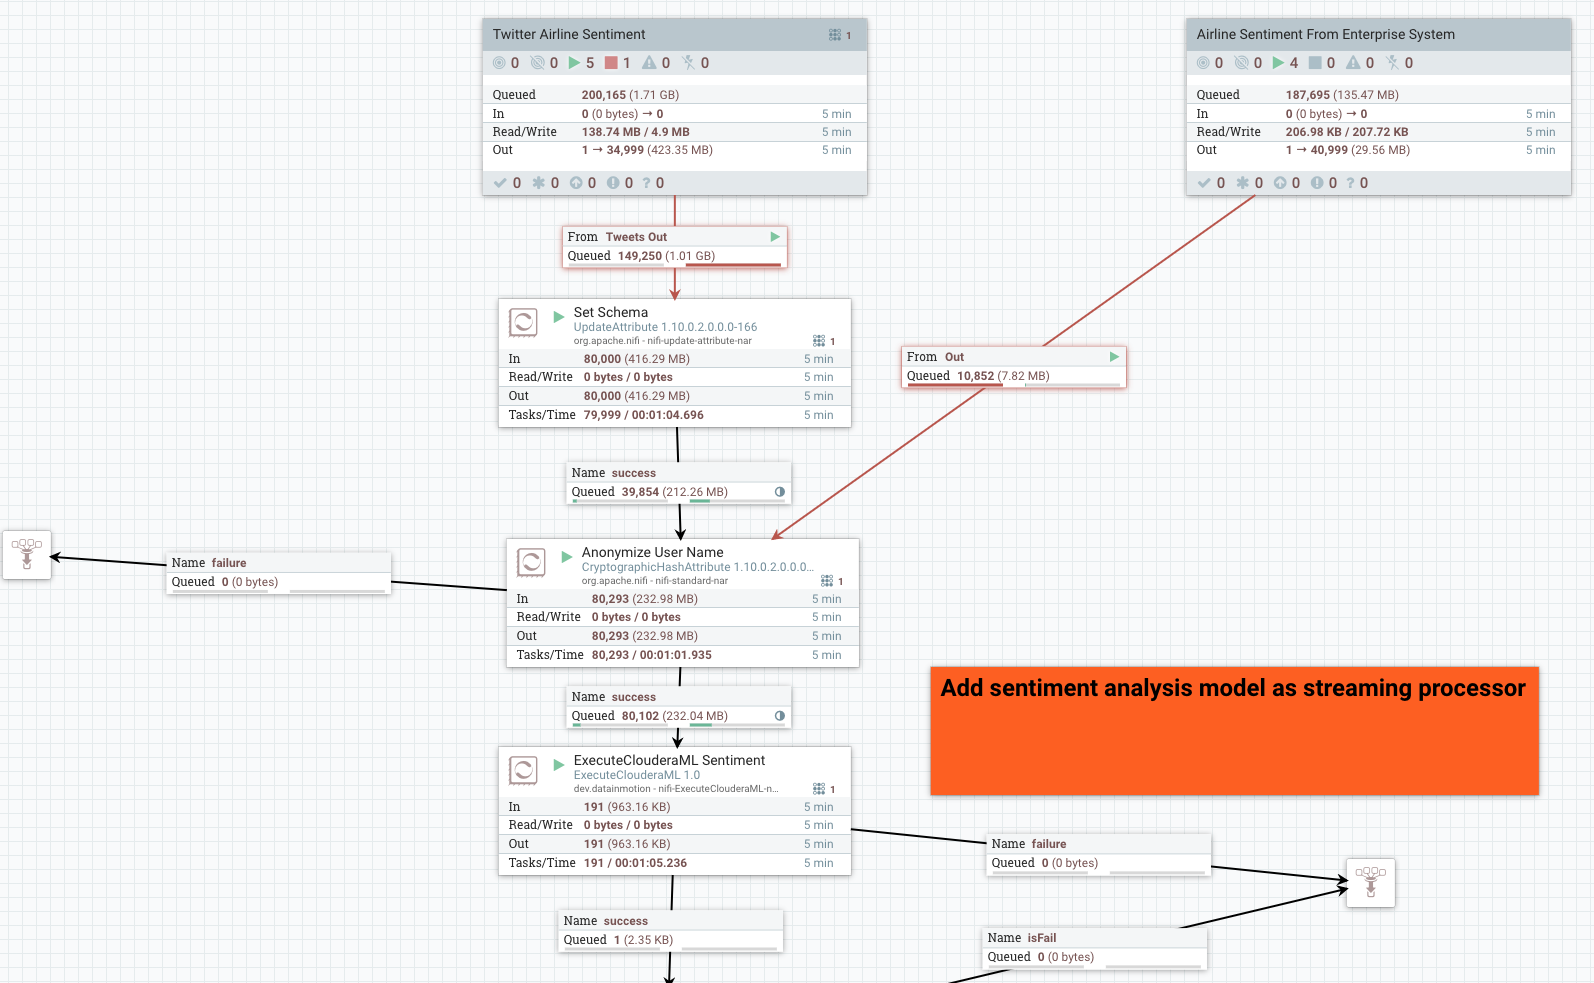
Using Cloudera Flow Management (CFM) I am ingesting real-time Twitter streams which I filter for
only airline specific data. I then clean and transform these records in a few simple steps.
The next pieces I will need are those two critical values from CML: the Access Key and
URL for the model. I will add them to an instance of an ExecuteClouderaML processor.

I am also sending the raw tweet (large JSON files) to a Kafka topic for further processing by other
teams.
I also need to store this data to tables for ad-hoc queries. So I quickly spin up a virtual warehouse
with Impala for reporting uses. I will put my data into S3 buckets as Parquet files, with an external
Impala table on top, for these reports.


Once my environment is ready, which will only take a few minutes, I will launch Hue to create a table.


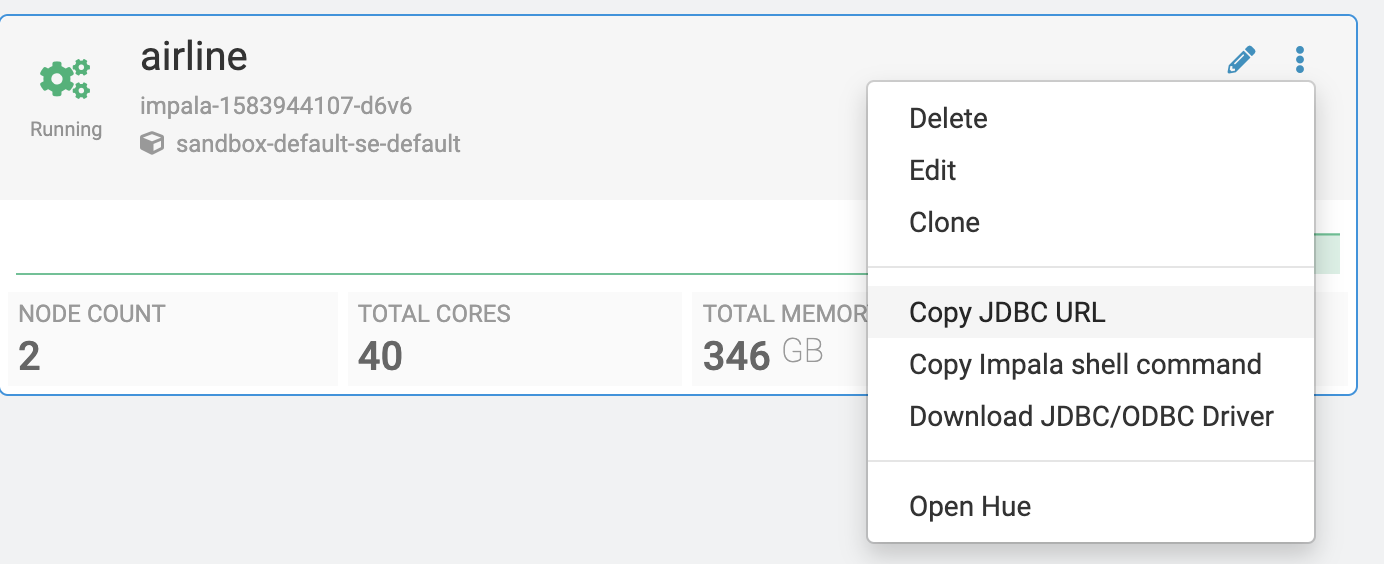
From the virtual warehouse I can grab the JDBC URL that I will need to add to my Impala Connection
pool in CFM for connecting to the warehouse. I will also need the JDBC driver.

From CFM I add a JDBC Controller and copy in the URL, the Impala driver name and a link to that
JDBC jar. I will also set my user and password, or Kerberos credentials, to connect.


After having called CML from CFM, I can see the scoring results and now use them to augment my
twitter data. The data is added to the attributes for each event and does not affect the current
flowfile data.
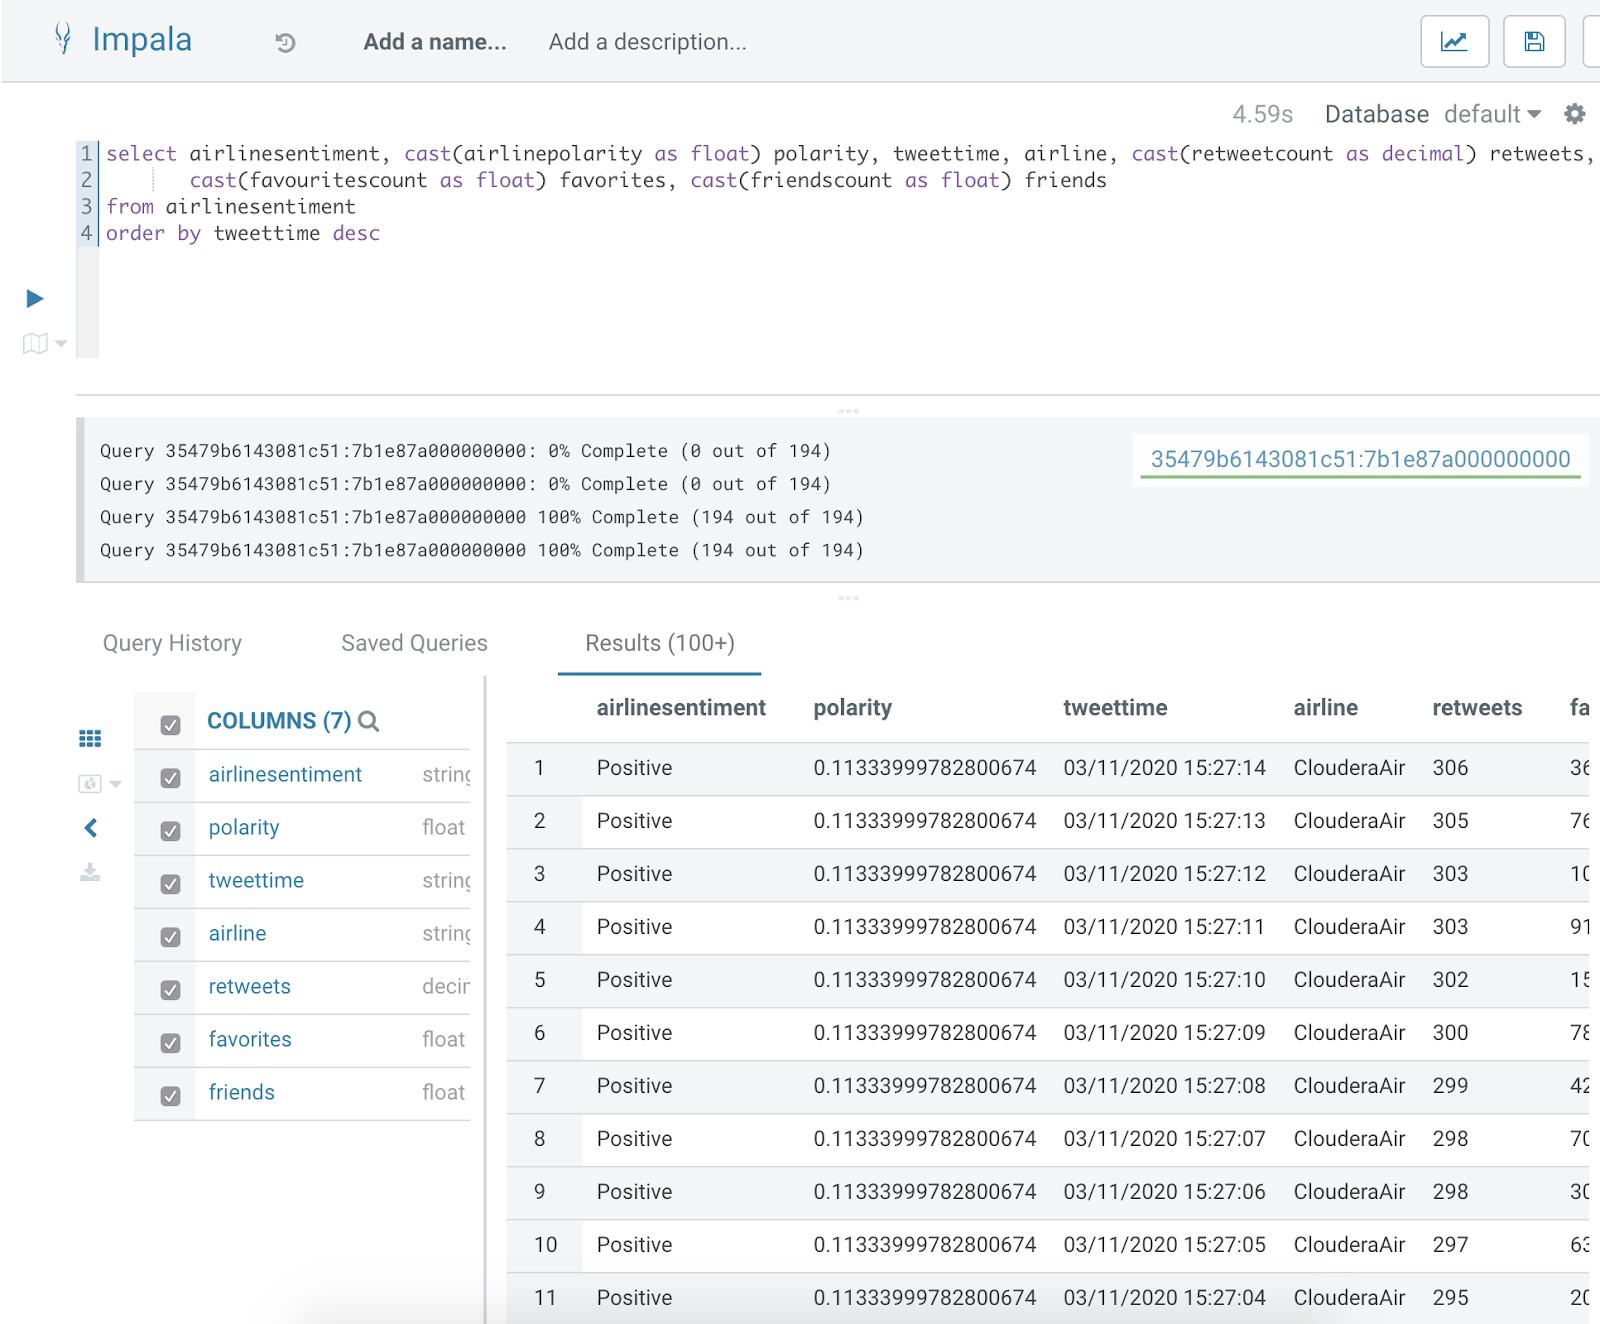
Now that data is streaming into Impala I can run ad-hoc queries and build charts on my
sentiment-enriched, cleaned-up twitter data.
For those of you that love the command line, we can grab a link to the Impala command line tool
for the virtual warehouse as well, and query from there. Good for quick checks.

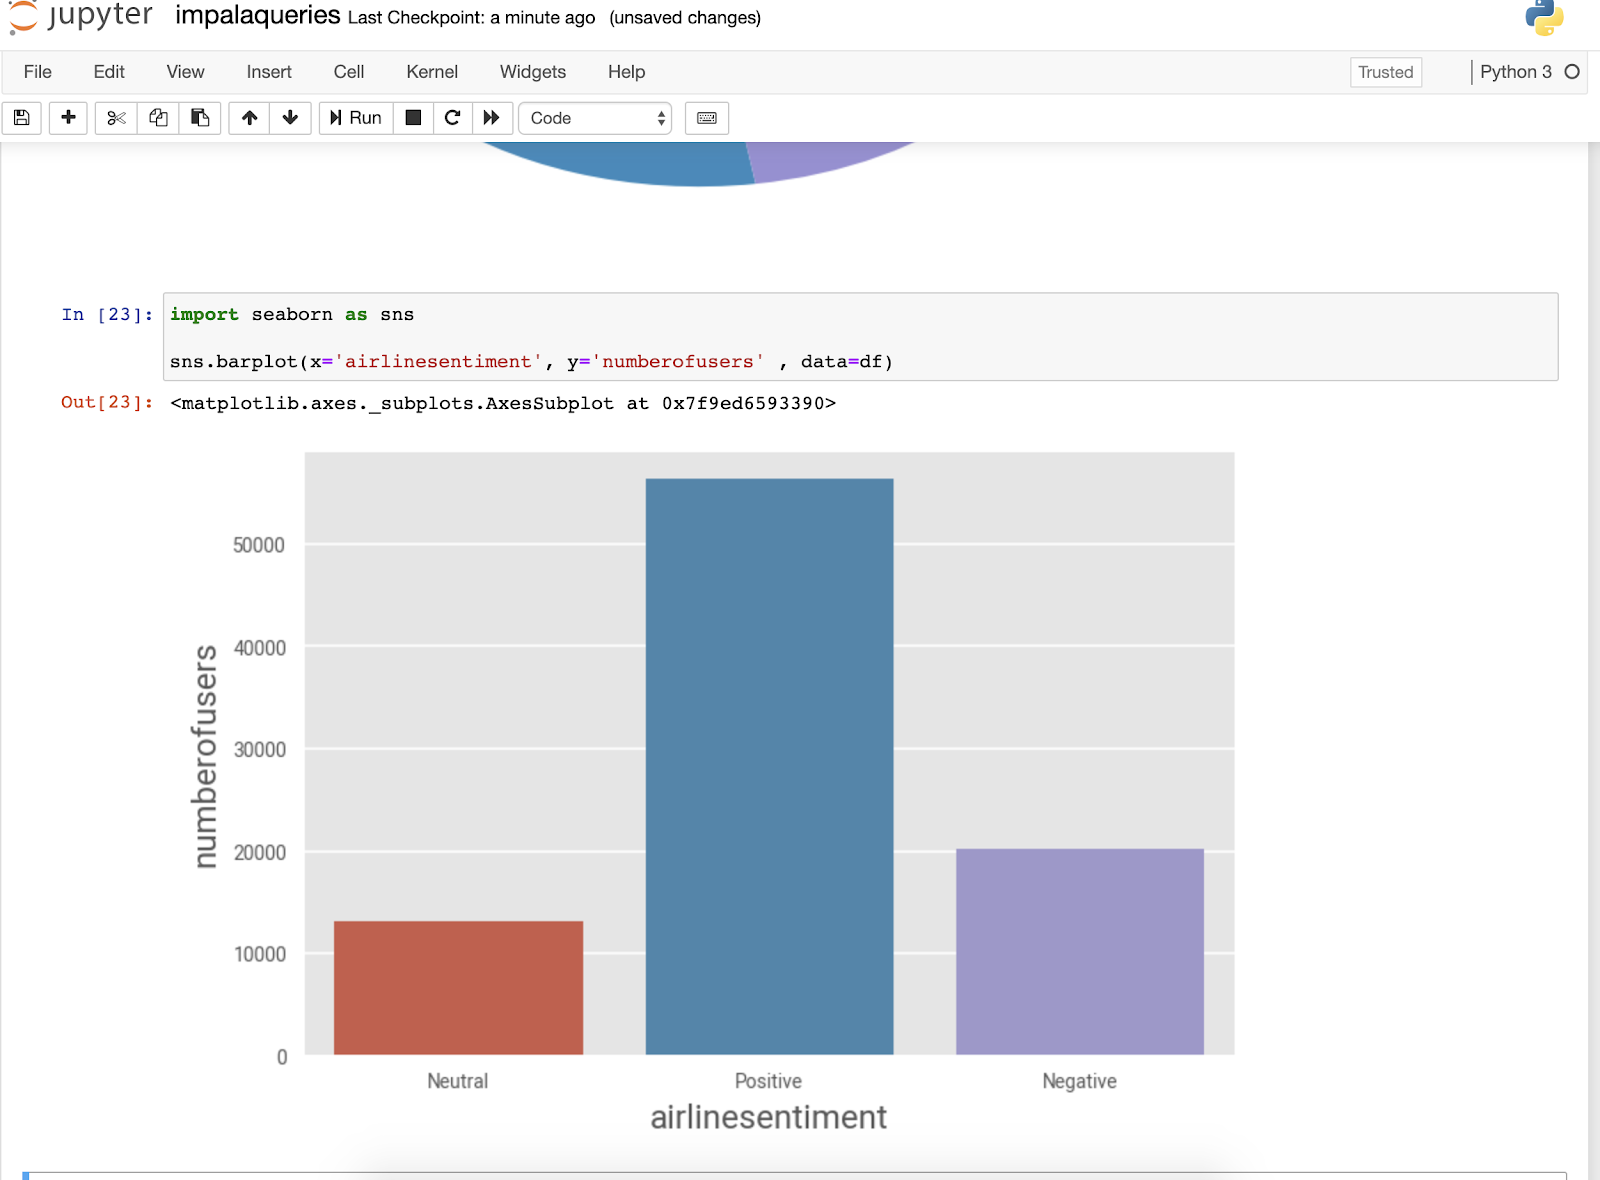
In another section of our flow we are also storing our enriched tweets in a CDP Data Center
(CDP-DC) Kudu table for additional analytics that we are running in Hue and in a Jupyter notebook
that we spin up with our CDP-DC CML.
that we spin up with our CDP-DC CML.


Jupyter notebooks spun up from Cloudera Machine Learning let me explore my data and do some charting, graphs and SQL work in Python3.


One of the amazing features that comes in handy when you have a complex flow that spans a hybrid
environment is to have data management and governance abilities. We can do that with Apache Atlas.
We can navigate and search through Atlas to see how data travels through Apache NiFi, Apache
Kafka, tables and Cloudera Machine Learning model activities like deployment.
environment is to have data management and governance abilities. We can do that with Apache Atlas.
We can navigate and search through Atlas to see how data travels through Apache NiFi, Apache
Kafka, tables and Cloudera Machine Learning model activities like deployment.


Final DataFlow For Scoring

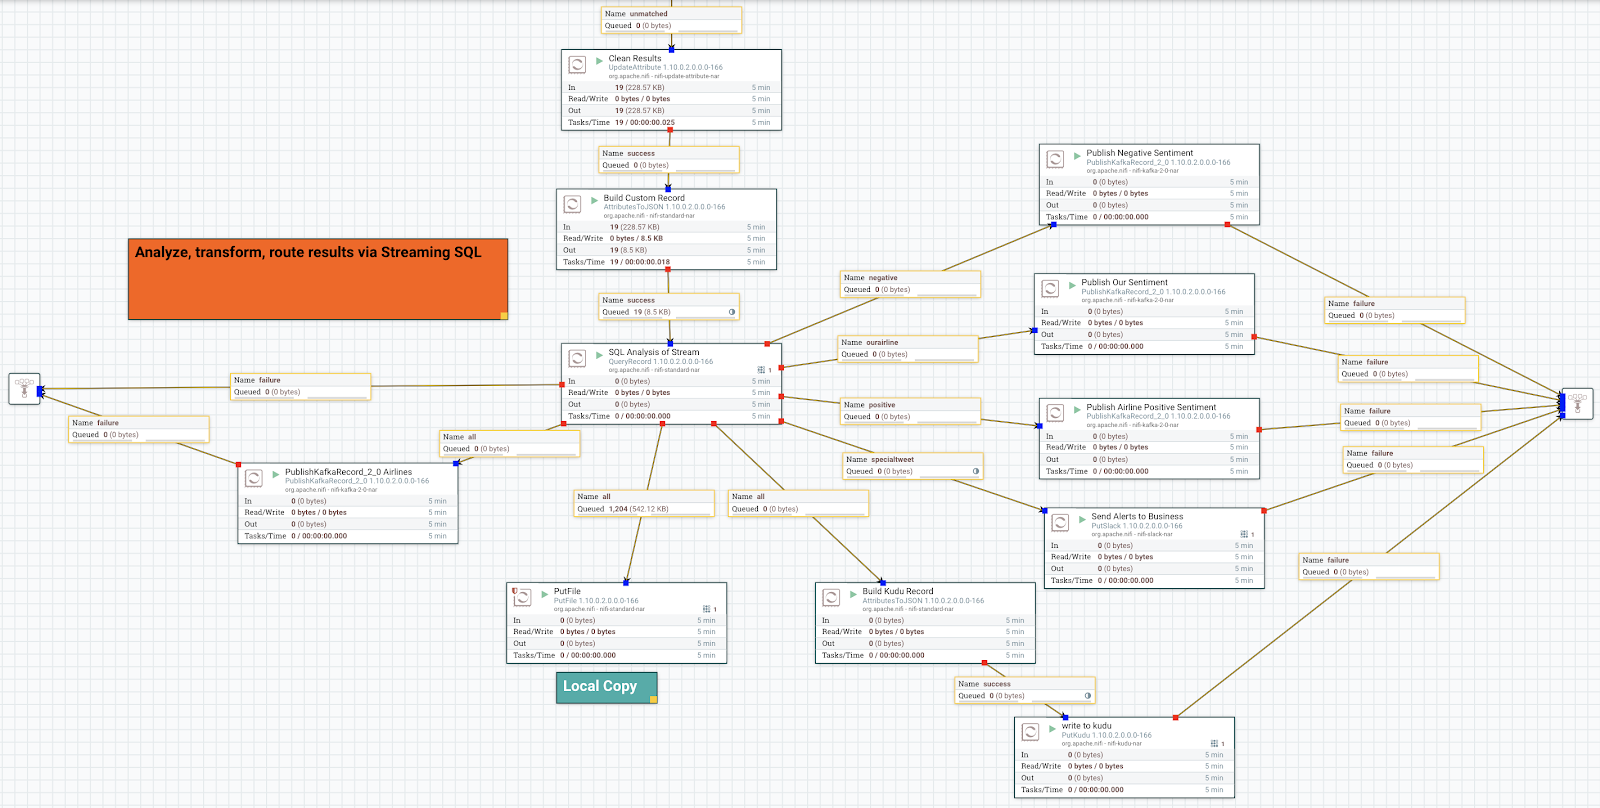
We have a Query Record processor in CFM that analyzes the streaming events and looks for
Negative sentiment by influencers, we then push those events to a Slack channel for our social
media team to handle.
Negative sentiment by influencers, we then push those events to a Slack channel for our social
media team to handle.

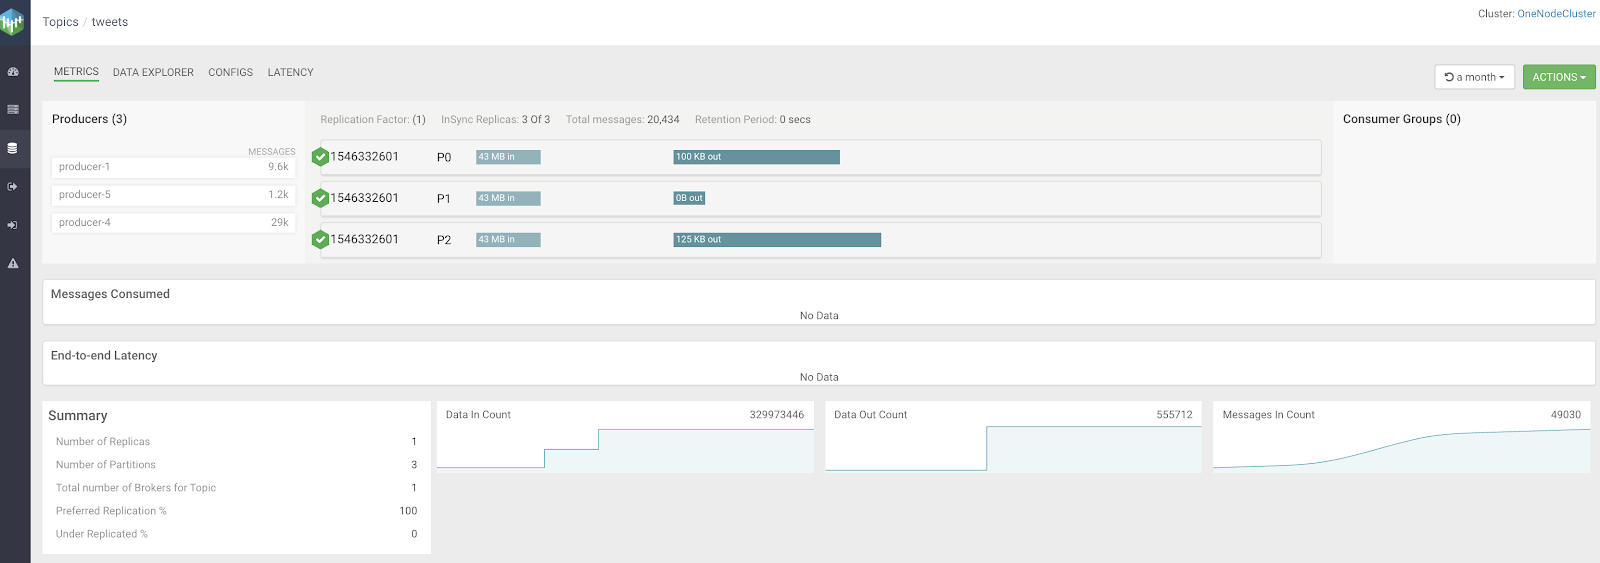
As we have seen, we are sending several different streams of data to Kafka topics for further
processing with Spark Streaming, Flink, NiFi, Java and Kafka Streams applications. Using
Cloudera Streams Messaging Manager we can see all the components of our Kafka cluster
and where our events are as they travel through topics in various brokers. You can see
messages in all of the partitions, you can also build up alerts for any part of your Kafka system.
An important piece is you can trace messages from all of the consumers to all of the producers
and see any lag or latency that occurs in clients.


We can also push to our Operational Database (HBase) and easily scan through the rapidly inserted rows.

This demo was presented in the webinar,
Harnessing the Data Lifecycle for Customer Experience Optimization.
Harnessing the Data Lifecycle for Customer Experience Optimization.
Source Code Resources
Queries, Python, Models, Notebooks
Example Cloudera Machine Learning Connector
SQL


