Connecting Apache NiFi to Apache Atlas For Data Governance At Scale in Streaming


Connecting Apache NiFi to Apache Atlas For Data Governance At Scale in Streaming


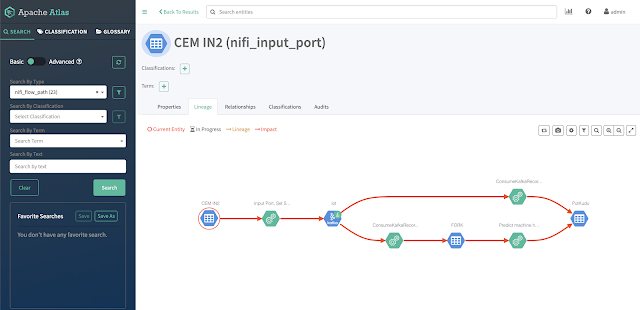
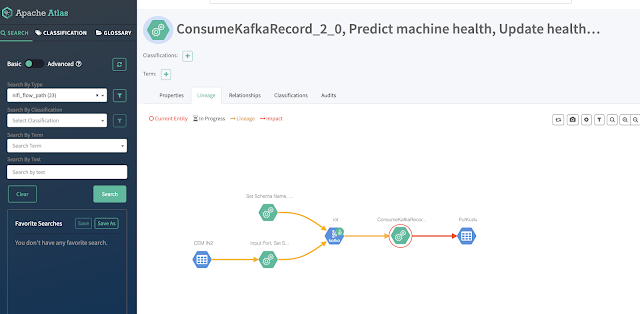
Once connected you can see NiFi and Kafka flowing to Atlas.

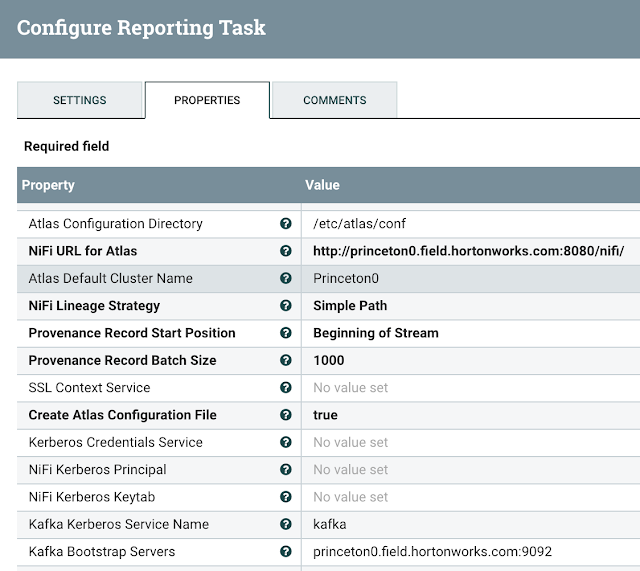
You must add Atlas Report to NiFi cluster.


Add a ReportLineageToAtlas under Controller Settings / Reporting Tasks
You must add URL for Atlas, Authentication method and if basic, username/password.


You need to set Atlas Configuration directory, NiFi URL to use, Lineage Strategy - Complete Path


Another example with an AWS hosted NiFi and Atlas:


IMPORTANT NOTE:   Keep your Atlas Default Cluster Name consistent with other applications for Cloudera clusters, usually the name cm is a great option or default.


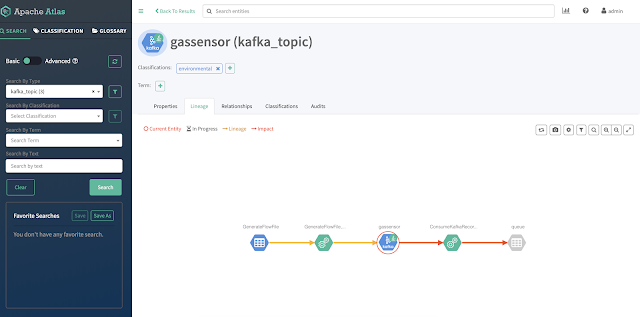
You can now see the lineage state:


Configure Atlas to Be Enabled and Have Kafka


Have Atlas Service enabled in NiFi configuration


Example Configuration

You must have access to Atlas Application Properties.

/etc/atlas/conf


atlas-application.properties 

#Generated by Apache NiFi ReportLineageToAtlas ReportingTask at 2020-02-21T17:18:28.493Z
#Fri Feb 21 17:18:28 UTC 2020
atlas.kafka.bootstrap.servers=princeton0.field.hortonworks.com\:9092
atlas.enableTLS=false
atlas.kafka.client.id=ReportLineageToAtlas.687a48e2-0170-1000-0000-00000a0de4ea
atlas.cluster.name=Princeton0

atlas.kafka.security.protocol=PLAINTEXT


atlas-server.properties 

princeton0.field.hortonworks.com:atlas.authentication.method.kerberos=false
princeton0.field.hortonworks.com:atlas.enableTLS=false
princeton0.field.hortonworks.com:atlas.kafka.zookeeper.connection.timeout.ms=30000
princeton0.field.hortonworks.com:atlas.kafka.zookeeper.session.timeout.ms=60000
princeton0.field.hortonworks.com:atlas.kafka.zookeeper.sync.time.ms=20
princeton0.field.hortonworks.com:atlas.server.bind.address=0.0.0.0
princeton0.field.hortonworks.com:atlas.server.http.port=31000

princeton0.field.hortonworks.com:atlas.server.https.port=31443


Running Atlas


See:   


Example SMM Notification Email


Example SMM Notification Email


Notification id: 12f61ec2-11a3-45ba-b7bb-2416d8a1b076,
Root resource name: ANY,
Root resource type: CONSUMER,
Created timestamp: Tue Jan 07 21:13:45 UTC 2020 : 1578431625199,
Last updated timestamp: Mon Jan 13 13:09:38 UTC 2020 : 1578920978293,
State: RAISED,

Message:

Alert policy : "ALERT IF ( ANY CONSUMER MILLISECONDS_LAPSED_SINCE_CONSUMER_WAS_ACTIVE >= 1200 )" has been evaluated to true Condition : "MILLISECONDS_LAPSED_SINCE_CONSUMER_WAS_ACTIVE>=1200" has been evaluated to true for following CONSUMERS - CONSUMER = "tensorflow-nifi-aws-client" had following attribute values * MILLISECONDS_LAPSED_SINCE_CONSUMER_WAS_ACTIVE = 308208428 - CONSUMER = "atlas" had following attribute values * MILLISECONDS_LAPSED_SINCE_CONSUMER_WAS_ACTIVE = 596819269 - CONSUMER = "nifi-gassensor-aws-client" had following attribute values * MILLISECONDS_LAPSED_SINCE_CONSUMER_WAS_ACTIVE = 310692570 - CONSUMER = "NIFI-TEST-GROUP-1" had following attribute values * MILLISECONDS_LAPSED_SINCE_CONSUMER_WAS_ACTIVE = 231168806 - CONSUMER = "bme680-nifi-client" had following attribute values * MILLISECONDS_LAPSED_SINCE_CONSUMER_WAS_ACTIVE = 291113014 - CONSUMER = "JUNIT_GROUP_TEST" had following attribute values * MILLISECONDS_LAPSED_SINCE_CONSUMER_WAS_ACTIVE = 250840173 - CONSUMER = "__smm-app" had following attribute values * MILLISECONDS_LAPSED_SINCE_CONSUMER_WAS_ACTIVE = 9223372036854775807 - CONSUMER = "nifi-kafka-group" had following attribute values * MILLISECONDS_LAPSED_SINCE_CONSUMER_WAS_ACTIVE = 291111173

Apache Atlas for Monitoring Edge2AI IoT Flows

Apache Atlas for Monitoring Edge2AI IoT Flows


EdgeAI: Jetson Nano with MiNiFi C++ Agent

Build and Utilizing The Apache NiFi - MiNiFi C++ Agent For Jetson Nano

(EdgeAI:   Jetson Nano with MiNiFi C++ Agent)


source.hostname
jetsonnano

source.ipv4
192.168.1.217

GetUSBCamera

FPS: .5


Bootstrap and Build

/opt/demo/nifi-minifi-cpp-source/build

bootstrap.sh

Options:  Kafka, OpenCV, TensorFlow, USB Camera


****************************************
 Select MiNiFi C++ Features to toggle.
****************************************
A. Persistent Repositories .....Enabled
B. Lib Curl Features ...........Enabled
C. Lib Archive Features ........Enabled
D. Execute Script support ......Enabled
E. Expression Language support .Enabled
F. Kafka support ...............Enabled
G. PCAP support ................Disabled
H. USB Camera support ..........Enabled
I. GPS support .................Disabled
J. TensorFlow Support ..........Disabled
K. Bustache Support ............Disabled
L. MQTT Support ................Enabled
M. SQLite Support ..............Disabled
N. Python Support ..............Enabled
O. COAP Support ................Enabled
S. SFTP Support ................Enabled
V. AWS Support .................Disabled
T. OpenCV Support ..............Enabled
U. OPC-UA Support...............Enabled

****************************************

sudo apt-get install libcurl-dev libcurl4-openssl-dev -y
make


We can see when data arrives in NiFi from a MiNiFi Agent.


 We can publish to Kafka directly from our MiNiFi C++ agent.


If CEM/Edge Flow Manager is a mystery to you, check out the live Swagger REST Documentation.


With MiNiFi C++ I can add a USB Camera.


 In NiFi we can see the Host Information that MiNiFi attached.


Example Data


{"uuid": "nano_uuid_crr_20200218002610", "ipaddress": "192.168.1.217", "top1pct": 54.833984375, "top1": "cab, hack, taxi, taxicab", "cputemp": "45.5", "gputemp": "43.5", "gputempf": "110", "cputempf": "114", "runtime": "4", "host": "jetsonnano", "filename": "/opt/demo/images/image_esq_20200218002610.jpg", "imageinput": "/opt/demo/images/2020-02-17_1926.jpg", "host_name": "jetsonnano", "macaddress": "ec:08:6b:18:0d:7f", "end": "1581985574.6246474", "te": "4.158604383468628", "systemtime": "02/17/2020 19:26:14", "cpu": 51.8, "diskusage": "5479.7 MB", "memory": 71.4, "id": "20200218002610_8a12dd65-1038-41ac-b923-98fc907f5be0"}

Example Config.yml Section


  name: AppendHostInfo
  class: org.apache.nifi.minifi.processors.AppendHostInfo
  max concurrent tasks: 1
  scheduling strategy: TIMER_DRIVEN
  scheduling period: 1000 ms
  penalization period: 30000 ms
  yield period: 1000 ms
  run duration nanos: 0
  auto-terminated relationships list: []
  Properties:
    Hostname Attribute: source.hostname
    IP Attribute: source.ipv4
    Network Interface Name: wlan0

Example Output


[2020-02-11 19:35:09.116] [org::apache::nifi::minifi::processors::ExecuteProcess] [info] Execute Command /opt/demo/rundemo.sh 
[2020-02-11 19:35:11.275] [org::apache::nifi::minifi::c2::C2Agent] [info] Checking 0 triggers
[2020-02-11 19:35:13.742] [org::apache::nifi::minifi::c2::C2Agent] [info] Checking 0 triggers
[2020-02-11 19:35:15.568] [org::apache::nifi::minifi::core::ProcessSession] [info] Transferring 899b5964-4d2f-11ea-8b9a-6e260e221e3d from ExecuteProcess - Python to relationship success
[2020-02-11 19:35:15.568] [org::apache::nifi::minifi::processors::ExecuteProcess] [info] Execute Command Complete /opt/demo/rundemo.sh status 0 pid 31004
[2020-02-11 19:35:15.569] [org::apache::nifi::minifi::core::ProcessSession] [info] Transferring 899b5964-4d2f-11ea-8b9a-6e260e221e3d from AppendHostInfo to relationship success
[2020-02-11 19:35:15.649] [org::apache::nifi::minifi::sitetosite::SiteToSiteClient] [info] Site to Site transaction 4d0b460e-e4f6-4ca1-8c56-30d310a0712b sent flow 1flow records, with total size 3581
[2020-02-11 19:35:15.785] [org::apache::nifi::minifi::sitetosite::HttpSiteToSiteClient] [info] Site to Site closed transaction 4d0b460e-e4f6-4ca1-8c56-30d310a0712b
[2020-02-11 19:35:15.841] [org::apache::nifi::minifi::sitetosite::SiteToSiteClient] [info] Site2Site transaction 4d0b460e-e4f6-4ca1-8c56-30d310a0712b peer finished transaction
[2020-02-11 19:35:15.841] [org::apache::nifi::minifi::io::HttpStream] [warning] Future status already cleared for http://ec2-35-171-154-174.compute-1.amazonaws.com:8080/nifi-api/data-transfer/input-ports/17979d5f-0170-1000-0000-000011f1cc00/transactions/4d0b460e-e4f6-4ca1-8c56-30d310a0712b/flow-files, continuing
[2020-02-11 19:35:16.236] [org::apache::nifi::minifi::c2::C2Agent] [info] Checking 0 triggers
[2020-02-11 19:35:16.263] [org::apache::nifi::minifi::core::ProcessSession] [info] Transferring 8a05413a-4d2f-11ea-8b9a-6e260e221e3d from TailFile to relationship success
[2020-02-11 19:35:16.264] [org::apache::nifi::minifi::processors::TailFile] [info] TailFile nano.log for 616 bytes
[2020-02-11 19:35:16.273] [org::apache::nifi::minifi::core::ProcessSession] [info] Transferring 8a05413a-4d2f-11ea-8b9a-6e260e221e3d from AppendHostInfo to relationship success
[2020-02-11 19:35:16.274] [org::apache::nifi::minifi::core::ProcessSession] [info] Transferring 8a05413a-4d2f-11ea-8b9a-6e260e221e3d from PublishKafka to relationship success
[2020-02-11 19:35:18.748] [org::apache::nifi::minifi::c2::C2Agent] [info] Checking 0 triggers
[2020-02-11 19:35:21.260] [org::apache::nifi::minifi::c2::C2Agent] [info] Checking 0 triggers

Using Apache NiFi - MiNiFi C++ Agent Elsewhere

I am working on a Jetbot robot powered by NVidia Jetson Nano that will use the MiNiFi C++ agent.


References


Quick Tip: NiFi JSON Cleanup

From Vasilis Vagias:


evaluateJsonPath immediately after the InvokeHTTP and replace the flowfile content with the $.response then NiFi unescapes and removes the additional quotes auto magically.

This is helpful for occasions when CDSW returns JSON or other REST APIs which may double encode JSON files.

QuickTip: Ingesting Google Analytics API with Apache NiFi

QuickTip:   Ingesting Google Analytics API with Apache NiFi 


Design your query / test the API here:

https://ga-dev-tools.appspot.com/query-explorer/


Building this NiFi flow is trivial.


Add your URL with tokens from the Query Explorer console.


You will need to reference the JRE that NiFi is using and it's cacerts if you don't want to build your own trust store.   The default password for JDK 8 is changeit.   No really.


Here are our results in clean JSON


Here are some attributes NiFi shows.


Example JSON Results

{
  "kind": "analytics#gaData",
  "id": "https://www.googleapis.com/analytics/v3/data/ga?ids=ga:33&metrics=ga:users,ga:percentNewSessions,ga:sessions&start-date=30daysAgo&end-date=yesterday",
  "query": {
    "start-date": "30daysAgo",
    "end-date": "yesterday",
    "ids": "ga:33",
    "metrics": [
      "ga:users",
      "ga:percentNewSessions",
      "ga:sessions"
    ],
    "start-index": 1,
    "max-results": 1000
  },
  "itemsPerPage": 1000,
  "totalResults": 0,
  "selfLink": "https://www.googleapis.com/analytics/v3/data/ga?ids=ga:33&metrics=ga:users,ga:percentNewSessions,ga:sessions&start-date=30daysAgo&end-date=yesterday",
  "profileInfo": {
    "profileId": "333",
    "accountId": "333",
    "webPropertyId": "UA-333-3",
    "internalWebPropertyId": "33",
    "profileName": "monitorenergy.blogspot.com/",
    "tableId": "ga:33"
  },
  "containsSampledData": false,
  "columnHeaders": [
    {
      "name": "ga:users",
      "columnType": "METRIC",
      "dataType": "INTEGER"
    },
    {
      "name": "ga:percentNewSessions",
      "columnType": "METRIC",
      "dataType": "PERCENT"
    },
    {
      "name": "ga:sessions",
      "columnType": "METRIC",
      "dataType": "INTEGER"
    }
  ],
  "totalsForAllResults": {
    "ga:users": "0",
    "ga:percentNewSessions": "0.0",
    "ga:sessions": "0"
  }
}

You should have a lot more data depending on what you have Google Analytics pointing to.   From here you can use QueryRecord or another record processor to automatically covert, query or route this data.   You can infer a schema or build up a permanent one and store it in Cloudera Schema Registry.   I recommend doing that if this is a frequent process.

Download a reference NiFi flow here:

https://github.com/tspannhw/flows

References:

https://developers.google.com/analytics/devguides/reporting/core/v4

https://developers.google.com/analytics

Analyzing Wood Burning Stoves with FLaNK Stack Part 2 - Analytics

Analyzing Wood Burning Stoves with FLaNK Stack Part 2 - Analytics - Part 2

Part 1:  https://www.datainmotion.dev/2020/01/analyzing-wood-burning-stoves-with.html

See:   https://shop.pimoroni.com/products/sgp30-air-quality-sensor-breakout
  • Sensiron SGP30 TVOC and eCO2 sensor
  • TVOC sensing from 0-60,000 ppb (parts per billion)
  • CO2 sensing from 400 to 60,000 ppm (parts per million)
Running the fire I can see I am getting higher CO2 production than normal.

Since I stored my data in Kudu tables, it's easy to analyze with Impala and Hue.


select equivalentco2ppm, totalvocppb, systemtime
from gassensors
order by equivalentco2ppm desc


select avg( cast(  equivalentco2ppm as double) ) CO2PPM
from gassensors

The average was 493.

Now that we have some time series data, I can start feeding this to some standard machine learning algorithms and have CML and a Data Scientist if me some analytics and help me determine where I a may want an alert.


Up to 400 is considered normal.

400 to 1,000 is typical of occupied locations with air exchange.

Once you get over 1,000 you start getting drowsy and noticeable effects.

Over 2,000 you get headaches, this is a concern.   Over 5,000 you should remove yourself from the situation.   

select appx_median(cast(equivalentco2ppm as double)) median, min(cast(equivalentco2ppm as double)) min, 
       max(cast(equivalentco2ppm as double)) max, avg(cast(equivalentco2ppm as double)) avg, 
stddev(cast(equivalentco2ppm as double)) standarddev,
stddev_pop(cast(equivalentco2ppm as double)) standardpop
from gassensors


Let's start setting alerts at various levels.

We can also look at the indoor air quality.


As a baseline for the sensor, in an empty ventilated room my numbers are:


{"uuid": "sgp30_uuid_glv_20200123132631", "ipaddress": "192.168.1.221", "runtime": "0", "host": "garden3", "host_name": "garden3", "macaddress": "dc:a6:32:32:98:20", "end": "1579785991.7173052", "te": "0.0261075496673584", "systemtime": "01/23/2020 08:26:31", "cpu": 53.5, "diskusage": "109138.7 MB", "memory": 46.5, "equivalentco2ppm": "  412", "totalvocppb": "    6", "id": "20200123132631_dec207f1-9234-4bee-ad38-a0256629c976"}
{"uuid": "sgp30_uuid_snt_20200123132633", "ipaddress": "192.168.1.221", "runtime": "0", "host": "garden3", "host_name": "garden3", "macaddress": "dc:a6:32:32:98:20", "end": "1579785993.7479923", "te": "0.02589273452758789", "systemtime": "01/23/2020 08:26:33", "cpu": 55.6, "diskusage": "109137.0 MB", "memory": 46.5, "equivalentco2ppm": "  403", "totalvocppb": "    5", "id": "20200123132633_3bd5fb39-d6b2-4f23-8904-0ada862ede2b"}
{"uuid": "sgp30_uuid_uha_20200123132635", "ipaddress": "192.168.1.221", "runtime": "0", "host": "garden3", "host_name": "garden3", "macaddress": "dc:a6:32:32:98:20", "end": "1579785995.7779448", "te": "0.025917768478393555", "systemtime": "01/23/2020 08:26:35", "cpu": 51.1, "diskusage": "109135.3 MB", "memory": 46.5, "equivalentco2ppm": "  406", "totalvocppb": "    3", "id": "20200123132635_0412f445-9b8c-43a8-b34a-a5466f914be7"}
{"uuid": "sgp30_uuid_wau_20200123132637", "ipaddress": "192.168.1.221", "runtime": "0", "host": "garden3", "host_name": "garden3", "macaddress": "dc:a6:32:32:98:20", "end": "1579785997.8079107", "te": "0.02591681480407715", "systemtime": "01/23/2020 08:26:37", "cpu": 58.7, "diskusage": "109133.5 MB", "memory": 47.1, "equivalentco2ppm": "  406", "totalvocppb": "   13", "id": "20200123132637_73f069d9-0beb-4d06-a638-2bd92e50ece7"}
{"uuid": "sgp30_uuid_lse_20200123132639", "ipaddress": "192.168.1.221", "runtime": "0", "host": "garden3", "host_name": "garden3", "macaddress": "dc:a6:32:32:98:20", "end": "1579785999.83777", "te": "0.025897502899169922", "systemtime": "01/23/2020 08:26:39", "cpu": 53.1, "diskusage": "109131.6 MB", "memory": 46.5, "equivalentco2ppm": "  410", "totalvocppb": "    1", "id": "20200123132639_1aa392fe-0eb7-4332-9631-83ac5838e153"}

Very low parts per billion between 1 and 13, with nothing changing in the static room seems like that's a 10 ppb margin of error, we can run some queries in Hue for better stats.

Let's look at some data over time for TVOC.

select appx_median(cast(totalvocppb as double)) median, min(cast(totalvocppb as double)) min, 
       max(cast(totalvocppb as double)) max, avg(cast(totalvocppb as double)) avg, 
stddev(cast(totalvocppb as double)) standarddev,
stddev_pop(cast(totalvocppb as double)) standardpop
from gassensors


So what's a good TVOC?   On average we are below the range of potential irritation of 120 - 1200 ppb.   We do have some variance for sensor capabilities and lack of professional calibration.      Median and Average numbers look good.   The maximum is a bit disturbing but can be sensor error, warm up time or other data quality issues.   We'll have to dive more into the numbers.

Next we can look at PM 2.5 values.

Need to crowd source some science here.

We had 3,500+ records of data over 120.

select count(*)
from gassensors
where  cast(totalvocppb as double) > 120

I can see a number of records and the data climb as the fire burns and we add more cherry wood.

select systemtime, equivalentco2ppm, totalvocppb
from gassensors
where  cast(totalvocppb as double) > 120
order by systemtime asc

I should also note that the time series data is coming in every 2 seconds.

select to_timestamp(systemtime, 'MM/dd/yyyy HH:mm:ss'), EXTRACT(to_timestamp(systemtime, 'MM/dd/yyyy HH:mm:ss'), 
    'MINUTE') as minute , 
cast(totalvocppb as double) as TVOC, cast(equivalentco2ppm as double) CO2PPM

from gassensors
order by systemtime desc

Resources